 |
Introduction to Anthropometry.
Anthropometry is the study of human sizing - the dimensions
of the different parts of the body.
The simplest and most common form of anthropometry is Static
Anthropometry, where people are measured in unmoving, defined
postures. The measurement points on the body are called
Landmarks, and the measurement can be defined as a pure vertical
or horizontal distance, a straight line, or along the surface,
from one landmark to another.
The other kind of anthropometry is call Functional Anthropometry,
and includes dynamic reaches and strength measurement. This page
is about static anthropometry.
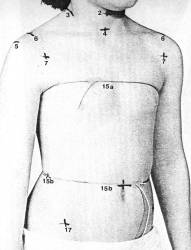
This picture shows a subject
marked up ready for measurement.
Some landmarks are actually bones under the surface of the
skin, found by feeling and then marked. For this reason 3-D
scanning is often supplemented by some direct physical
measurement. |

|
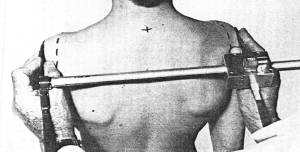
This is an anthropometer being used to
measure a straight-line distance between two landmarks.
An anthropometer is basically a large sliding calliper with
a numerical readout. |

|
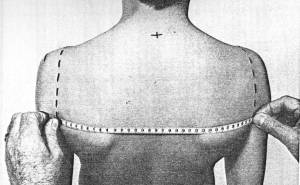
| Surface measurements are made with a simple
flexible tape measure, or derived from scan data. |
 |
Sampling
Surveys can only measure a sample of the people they are
interested in. Samples sizes range from 10's to
1000's, depending on the scope and purpose. In order
to have a good match between the sample and the
'population', generally a mix of random and targeted
selection is used, to make sure for example that a minority
group has enough representation. The larger the
sample, the less likely it is to have an unexpected bias.
It's a characteristic of human variation that most people
are near to the average, then there are proportionately
fewer and fewer people towards the extremes. In
ergonomics it is normally the extremes that we are
interested in, because that is where any given aspect of a
design will start to "not fit". The percentage of
people who are smaller than a given size is called a
"percentile", and typically designs are specified to fit
from 1st/2nd/5th percentile to 95th/98th/99th.
Because the actual size of (say) the 2nd percentile is
determined by the size of only 2 percent of the sample,
sample size has a dramatic effect on the reliability of the
resulting data - in a sample of 50 the smallest subject
is the 2nd percentile, so if that individual happens to
be particularly small,
or the same size as the 2nd smallest, that will produce an
error. In practice statistics are used to smooth out
the variation, but really then the error is just spread
evenly across all the percentiles.
It is difficult to recruit volunteers who are extremely
large or small, and in general government health surveys are
much more successful at this than commercial clothing
surveys. For that reason
clothing surveys
characteristically show people to be taller and lighter than
do government surveys.
|
What percentiles
to use?
Once you've identified the right anthropometry data, and understood the
measurement, you have to decide what percentiles to design
for. It's best to see this question in terms of excluding
a percentage of users from the design, and then formally to consider:
- What happens for excluded users - discomfort, inconvenience, danger etc?
The more severe the consequences, the fewer
exclusions you can allow.
- Do the excluded users expect this (e.g. a
very tall person may be used to being cramped
in an economy aircraft seat, but not in a
luxury car)?
- Can you warn the excluded users?
- Are there degrees of exclusion that you
should consider, beyond the basic target?
For example, set 95th percentile for one
non-critical dimension and 99th for another
that is more crucial.
- How much would it cost to increase the
design range?
|
Testing
It's never safe to go directly from anthropometric data to the finished
design. Any dataset has an error rate, and also the way
the measurement was taken may not relate all that well to the way
people will fit into and use your design in real life.
In addition there is an important issue that if more than one
dimension has to fit, every extra dimension will
exclude some more people. Consequently a series of
2nd-to-98th percentile dimensions excludes a lot more than 4%
of the users.
So you should always test with a Fitting Trial.
|
| |
|
|


